
This site contains affiliate links. As an Amazon Associate, I earn a commission from qualifying purchases at no extra cost to you. Full Disclosure Here.
Gun ownership can be a difficult thing to talk about in the United States, mainly because of all the opinions surrounding the subject. What makes things even more difficult is the fact that there’s so little real concrete information out there about overall trends and statistics.
To help shine a little light on the situation, we’re going to go over some important gun ownership statistics to help everyone have a more informed and well-grounded opinion. We won’t tell you what to think, but facts are facts, and they’re a good place for any debate to start.
We’re going to go over some key stats, as well as info about how many guns are actually in the US, how many people own them, who is likely to want to buy one, and how each state’s population compares when it comes to gun ownership.
Let’s dive right in.
Key Gun Ownership Statistics In The US
- There are approximately 77.49 million adult gun owners in the US.
- 2020 is believed to have had the highest number of firearm sales in history, with 39,695,315 background checks for the sale of firearms and explosives.
- Approximately 30% of American adults own a gun.
- Another 36% of adults could see themselves owning a gun in the future.
- The average American gun owner owns five guns.
- Personal protection is the most frequently cited reason for owning a gun.
- Texas is the state with the most guns, while Delaware is the state with the least.
- Wyoming is the state with the most guns per capita, while New York is the state with the fewest.
- Handguns are the most commonly owned type of gun, followed by rifles, then shotguns.
- Republicans are more than twice as likely as Democrats to own a gun.
How Many Guns Are In The US in 2022?

Currently as of December 2021 there are an estimated 436.4 million guns in the United States.
The last estimated number till March 2020 suggests that there are approximately 393,347,000 privately owned firearms in the United States.
According to the data for the year 2020 a record-breaking 22.8 million guns were bought, while the purchase number dipped in the year 2021 to 19.9 million.
We know that the Coronavirus pandemic led to a spike in gun purchases, then there was another spike in May and June in response to riots that occurred following the killing of George Floyd.
The federal government doesn’t track gun sales, but it does track background checks submitted to the FBI through the National Instant Criminal Background Check System (NICS), which are required to purchase a firearm from a gun store.
In 2020, there were a total of 39,695,315 background checks performed for firearm and explosive sales, representing a record-breaking year for firearms sales. In 2021, there were another 38,876,673.
Number of Guns Sold In The US from 2011-2021
Again, the federal government of the United States doesn’t track firearm sales, but it does track background checks required for gun sales by businesses. That means that these statistics don’t include private sales between individuals.
States With Highest & Lowest Number of Guns
| Year | Number of NICS Background Checks |
|---|---|
| 2011 | 16,454,951 |
| 2012 | 19,592,303 |
| 2013 | 21,093,273 |
| 2014 | 20,968,547 |
| 2015 | 23,141,970 |
| 2016 | 27,538,673 |
| 2017 | 25,235,215 |
| 2018 | 26,181,936 |
| 2019 | 28,369,750 |
| 2020 | 39,695,315 |
| 2021 | 38,876,673 |
The five states with the most guns are:
- Texas
- California
- Florida
- Virginia
- Pennsylvania
Meanwhile, the five states with the least guns are:
- Delaware
- Vermont
- Hawaii
- North Dakota
- Maine
In part, these differences can be explained by the availability of legal firearms and differences in the culture around firearms, but a lot of it is also due to population. That explains why California, a state where it’s relatively difficult to get ahold of firearms, is so high up on the list. There are simply more people in California to own firearms than in any other state.
For that reason, it’s also good to look at the number of guns per capita in states. That information is provided for you later on in this article.
| State | Number of Registered Guns |
|---|---|
| Texas | 588,696 |
| California | 344,622 |
| Florida | 343,288 |
| Virginia | 307,822 |
| Pennsylvania | 236,377 |
| Georgia | 190,050 |
| Arizona | 179,738 |
| Ohio | 173,405 |
| Alabama | 161,641 |
| North Carolina | 152,238 |
| Illinois | 146,487 |
| Wyoming | 132,806 |
| Louisiana | 116,831 |
| Indiana | 114,019 |
| South Carolina | 105,601 |
| Maryland | 103,109 |
| Tennessee | 99,159 |
| New Mexico | 97,580 |
| Colorado | 92,435 |
| Washington | 91,835 |
| Connecticut | 82,400 |
| Kentucky | 81,068 |
| Arkansas | 79,841 |
| Minnesota | 79,307 |
| Nevada | 76,888 |
| New York | 76,207 |
| Missouri | 72,996 |
| Utah | 72,856 |
| Oklahoma | 71,269 |
| Michigan | 65,742 |
| Wisconsin | 64,878 |
| New Hampshire | 64,135 |
| Oregon | 61,383 |
| New Jersey | 57,507 |
| Kansas | 52,634 |
| Idaho | 49,566 |
| Massachusetts | 37,152 |
| Rhode Island | 37,152 |
| Mississippi | 35,494 |
| West Virginia | 35,264 |
| Iowa | 28,494 |
| Nebraska | 22,234 |
| Montana | 22,133 |
| South Dakota | 21,130 |
| Alaska | 15,824 |
| Maine | 15,371 |
| North Dakota | 13,272 |
| Hawaii | 7,859 |
| Vermont | 5,872 |
| Delaware | 4,852 |
(Source: World Population Review)
How Many Gun Owners in America? Gun Ownership Statistics in US

According to a 2021 Pew Research Center survey, approximately 30% of American adults report owning a gun. The 2020 Census found that there were approximately 258.3 million adults living in the United States. That means there are roughly 77.49 million adult gun owners in the US.
However, that doesn’t take into account the number of children that own guns.
It also doesn’t take into account the number of adults who have purchased firearms for the first time since the purchasing boom in 2020 and 2021. While many of those purchasers were undoubtedly already gun owners, many of them were also likely to be first time gun buyers.
An older study from Pew Research Center, conducted in 2017, found that 30% of adults owned a gun, but another 36% of adults could see themselves owning a gun in the future. It’s quite possible that some portion of those people have become gun owners with the recent gun buying boom.
According to recent gun violence statistics, the increase in gun ownership could potentially lead to an increase in gun-related incidents.
Demographics of Gun Ownership In US
Gun Ownership In The US By Race
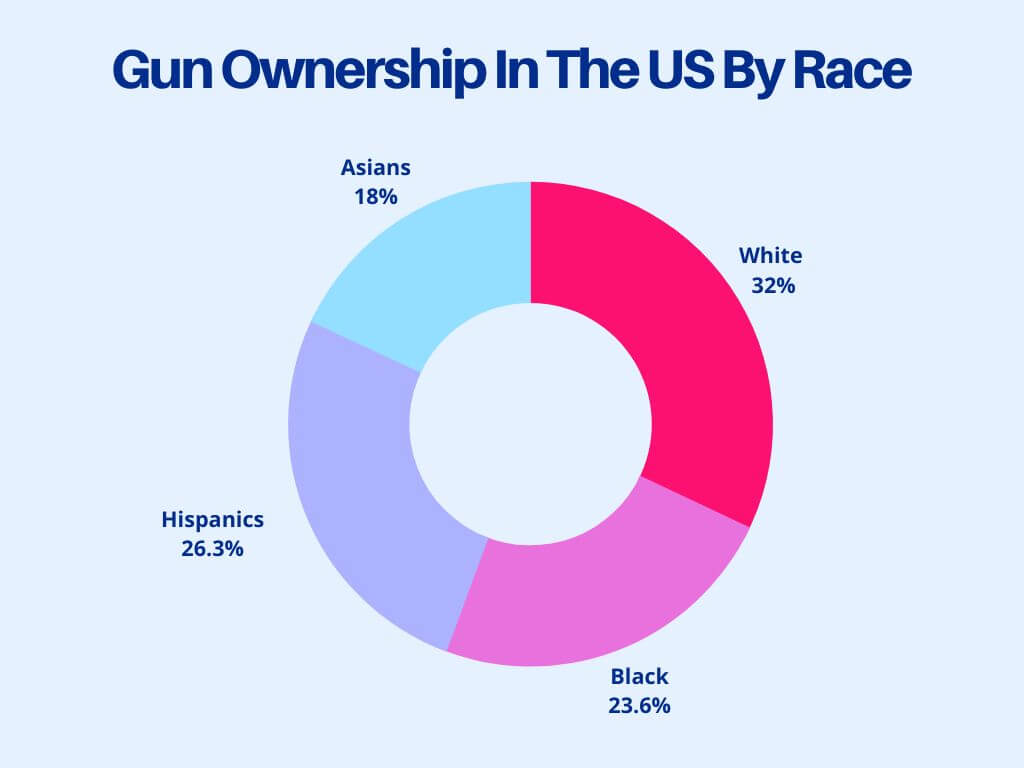
<a href="https://www.marineapproved.com/gun-ownership-statistics-in-america/" target="_blank"><img class="size-full wp-image-20519 aligncenter" src="https://www.marineapproved.com/wp-content/uploads/2022/06/Gun-Ownership-In-The-US-By-Race.jpg" alt="Gun Ownership In Us By Race from MarineApproved" width="1024" height="768" /></a>- White: 34.4%
- Black: 25.4%
- Hispanics: 28.3%
- Asians: 19.4%
Gun Ownership In The US By Political Followers
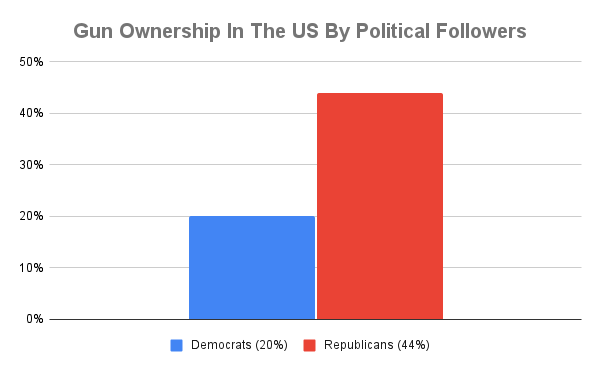
<a href="https://www.marineapproved.com/gun-ownership-statistics-in-america/" target="_blank"><img class="size-full wp-image-20518 aligncenter" src="https://www.marineapproved.com/wp-content/uploads/2022/07/Gun-Ownership-In-The-US-By-Political-Followers-1-1.png" alt="Gun ownership in Us By Political Followers By MarineApproved" width="600" height="371"></a>- Democrats: 20% personally own a gun
- Republicans: 44% personally own a gun
Gun Ownership In The US By Gun Type (% of Gun Owners Who Own This Firearm Type)
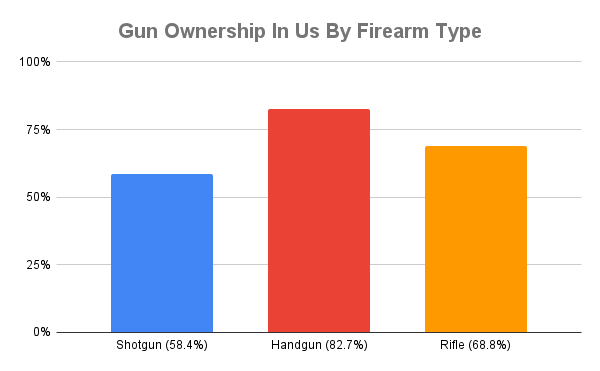
<a href="https://www.marineapproved.com/gun-ownership-statistics-in-america/" target="_blank"><img class="size-full wp-image-20519 aligncenter" src="https://www.marineapproved.com/wp-content/uploads/2022/07/Gun-Ownership-In-Us-By-Firearm-Type.png" alt="Gun Ownership In Us By Firearm Type Chart" width="600" height="371" /></a>- Shotgun: 58.4%
- Handgun: 82.7%
- Rifle: 68.8%
Gun Ownership In The US By Gender
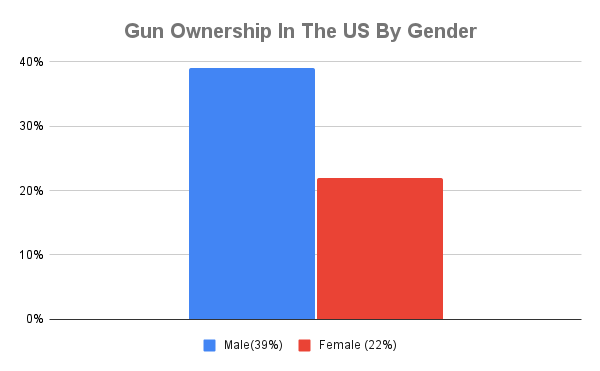
<a href="https://www.marineapproved.com/gun-ownership-statistics-in-america/" target="_blank"><img class="size-full wp-image-20519 aligncenter" src="https://www.marineapproved.com/wp-content/uploads/2022/07/Gun-Ownership-In-The-US-By-Gender.png" alt="Gun Ownership In Us By Gender from MarineApproved" width="600" height="371" /></a>- Male: 39% personally own a firearm, 45% live in a household that has a firearm
- Female: 22% personally own a firearm, 40% live in a household that has a firearm
(Source: Pew Research)
Average Guns Per Household In US
We don’t know how many guns there are per household in the United States. We do, however, know that the average firearm owner in the US owns 5 guns. Of course, there could be multiple gun owners within a household.
Gun Ownership Per Capita By State 2022
| State | Guns per 1000 People | Gun Ownership Rate |
|---|---|---|
| Wyoming | 228.10 | 66.20% |
| New Hampshire | 46.57 | 41.10% |
| New Mexico | 46.27 | 46.20% |
| Virginia | 35.63 | 44.60% |
| Rhode Island | 34.96 | 14.80% |
| Alabama | 32.66 | 55.50% |
| Arkansas | 26.25 | 57.20% |
| Idaho | 26.13 | 60.10% |
| Louisiana | 25.31 | 53.10% |
| Nevada | 23.74 | 47.30% |
| Arizona | 23.52 | 46.30% |
| South Dakota | 23.41 | 55.30% |
| Connecticut | 23.23 | 23.60% |
| Alaska | 21.95 | 64.50% |
| Utah | 21.67 | 46.80% |
| Montana | 20.25 | 66.30% |
| West Virginia | 20.09 | 58.50% |
| South Carolina | 19.77 | 49.40% |
| Texas | 19.56 | 45.70% |
| Pennsylvania | 18.46 | 40.70% |
| Kentucky | 18.07 | 54.60% |
| Kansas | 18.03 | 48.90% |
| Oklahoma | 17.79 | 54.70% |
| Georgia | 17.38 | 49.20% |
| North Dakota | 17.15 | 55.10% |
| Maryland | 16.97 | 30.20% |
| Indiana | 16.66 | 44.80% |
| Colorado | 15.51 | 45.10% |
| Florida | 15.48 | 35.30% |
| Ohio | 14.79 | 40.00% |
| Oregon | 14.19 | 50.80% |
| Tennessee | 14.16 | 51.60% |
| North Carolina | 14.09 | 45.80% |
| Minnesota | 13.82 | 42.80% |
| Mississippi | 11.98 | 55.80% |
| Missouri | 11.80 | 48.80% |
| Illinois | 11.70 | 27.80% |
| Washington | 11.64 | 42.10% |
| Nebraska | 11.34 | 45.20% |
| Maine | 11.30 | 46.80% |
| Wisconsin | 11.06 | 45.30% |
| Vermont | 9.43 | 50.50% |
| Iowa | 8.98 | 43.60% |
| California | 8.69 | 28.30% |
| Michigan | 6.58 | 40.20% |
| New Jersey | 6.48 | 14.70% |
| Hawaii | 5.61 | 14.90% |
| Massachusetts | 5.37 | 14.70% |
| Delaware | 4.86 | 34.40% |
| New York | 3.96 | 19.90% |
(Source: World Population Review)
Registered Gun Owners in US
There is no federal firearms registry in the United States, though some states do have registries of their own. These states are California, Hawaii, New York, Maryland, Connecticut and New Jersey, Washington D.C. also requires a firearm registration.
However, of these places, only California, Hawaii, and Washington D.C. require registration of all firearms. That means that we can’t use registration numbers to gauge the total number of gun owners in these places.
In total, there are approximately 77.49 million adult gun owners in the US.
How many guns does the average American own?
The average American firearm owner has a total of five guns. 21.9% of gun owners own just one firearm.
But what type of guns do Americans own?
Well, handguns are by far the most common, with 82.7% of gun owners reporting that they own a handgun. Next are rifles, with 68.8% reporting owning a rifle. That includes 30.2% of gun owners who own an AR-15 or similar modern sporting rifle (MSR). Perhaps unsurprisingly, shotguns are the least common, though hardly uncommon: 58.4% of gun owners say that they own a shotgun.
How many legal gun owners in America?
Overall, there are roughly 77.49 million adult gun owners in the United States. However, minors are also allowed to own guns in some states as well, so that number is low.
How many privately owned guns in the United States?
According to the most recent estimates made towards the beginning of 2020, there are about 393,347,000 privately owned firearms in the US.
However, since 2020, we’ve had a huge spike in gun purchases. Between 2020 and 2021, there were 78,571,988 background checks run through NICS for the purchase of firearms. In other words, the current number of privately owned guns in the United States is probably much higher now than it was in 2020.
Which state has the most guns per person?
Per capita, Wyoming has the most guns by a large margin, with approximately 228 guns per thousand people. In contrast, the state with the second-most guns per capita is New Hampshire, with 46.57 per thousand people.
Why do people in the US own guns?
Personal safety and protection is the most commonly cited reason for gun ownership with 63% of gun owners saying that personal safety is one reason that they own a gun.
40 percent of gun owners cite hunting as a reason they own a firearm, making hunting the second most popular reason for owning a gun.
The third most commonly cited reason for owning a gun among gun owners is recreation, with 11% of gun owners specifying that this is a reason that they own a gun.
Other, less common reasons gun owners say that they own guns include family heirlooms, work, to exercise their Second Amendment rights, family tradition, that they simply like guns, and target shooting.
Conclusion
Talking about gun ownership is difficult in the US, but we think it can at least be a discussion that’s founded on facts and figures, rather than emotion and “gut instinct”. From big legislation or backyard discussion, it’s something we should all be able to agree on.
Gun ownership is probably always going to be something of a sticky topic in the United States, but we can hopefully at least look at the actual facts and figures of the situation whenever we talk about it, and that starts with looking at real gun ownership statistics.